Russia is a large multi-religious state, in which live a variety of nationalities, each of them is equal in rights and is not infringed on rights.
In recent years, the statement that the population has been decreasing despite migration processes has constantly been heard from television screens. At the moment, the situation has changed: there is a natural increase.
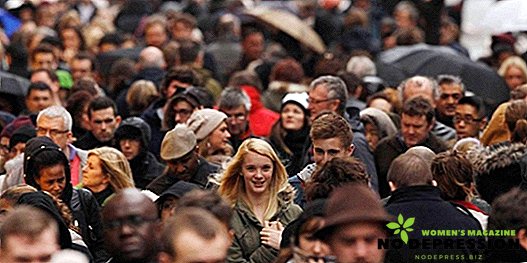
How many million people live in Russia now
As of January 1, 2017, according to the census results, there are 146,804,400 people. Of these, 109,032,400 are urban dwellers, the rest live in rural areas. The distribution of the population by district can be studied in detail in the table.
Table 1. The population of the Russians by districts.
| Name of the federal district | Number of resident citizens, thousand people | ||
|---|---|---|---|
| Total | In urban area | In the countryside | |
| Central | 39209,6 | 32189,4 | 7020,2 |
| Northwestern | 13899,3 | 11712,0 | 2187,3 |
| Southern | 16428,5 | 10252,7 | 6175,8 |
| North Caucasus | 9775,8 | 4803,6 | 4972,2 |
| Volga | 29636,5 | 21264,0 | 8372,5 |
| Ural | 12345,8 | 10028,4 | 2317,4 |
| Siberian | 19326,2 | 14103,5 | 5222,7 |
| Far Eastern | 6182,7 | 4678,8 | 1503,9 |
The total number of countries has increased over the period from the beginning of 2016 to the beginning of 2017 by 129,900 people, the change in different categories of citizens according to the criterion of their place of residence is not the same:
- urban population increased by 187,500;
- rural decreased by 57.6 thousand citizens.
In general, in all federal districts, an increase in the population was observed with the exception of the Volga and Far Eastern regions.

Russian population density
This indicator as of January 1, 2017 was 8.6 people per square kilometer. Of course, this indicator varies widely for all federal districts (FD), then they are presented in descending order:
- Central FD - 60.3 people /;
- North Caucasus - 57.4;
- Southern - 36.7;
- Privolzhsky - 28.6;
- North-West - 8.2;
- Ural - 6.8;
- Siberian - 3.8;
- Far East - 1.0.
This is explained quite simply:
- territories have different terrain;
- climatic conditions are not the same;
- the level of development of the economic component is different.
Annual dynamics: the population of Russia and its changes over the years
In the past few years, as already noted, the number of our country has begun to increase. From year to year it was uneven (see table 2).
Table 2. Dynamics of the population of Russia from 2007 to 2017.
| Reporting period | Population, million people | ||
|---|---|---|---|
| Generally | City dwellers | Residents of other settlements | |
| 2007 | 142,8 | 104,7 | 38,1 |
| 2008 | 142,8 | 104,9 | 37,9 |
| 2009 | 142,7 | 104,9 | 37,8 |
| 2010 | 142,9 | 105,3 | 37,6 |
| 2011 | 142,9 | 105,4 | 37,5 |
| 2012 | 143,0 | 105,7 | 37,3 |
| 2013 | 143,3 | 106,1 | 37,2 |
| 2014 | 143,7 | 106,6 | 37,1 |
| 2015 | 146,3 | 108,3 | 38,0 |
| 2016 | 146,5 | 108,6 | 37,9 |
| 2017 | 146,8 | 109,0 | 37,8 |
It is important to note that after the Republic of Crimea was included in the Russian Federation in 2014, the population was not increased at the expense of fertility.
How many people live on average in Russia: demographic situation
Average life expectancy is an indicator that is calculated for each specific generation, that is, for people born in one year. It is calculated on the basis of numerous indicators, it can be called a forecast for this particular generation.
Table 3. Estimated estimated life expectancy for people born from 1961 to 2016.
| Year of birth | Life expectancy, years | ||
|---|---|---|---|
| For the entire population | For men | For women | |
| 1961-1962 | 68,8 | 63,8 | 72,4 |
| 1970-1971 | 68,9 | 63,2 | 73,6 |
| 1980-1981 | 67,6 | 61,5 | 73,1 |
| 1990 | 69,2 | 63,7 | 74,3 |
| 1995 | 64,6 | 58,1 | 71,6 |
| 2000 | 65,3 | 59,0 | 72,3 |
| 2001 | 65,2 | 58,9 | 72,2 |
| 2002 | 65,0 | 58,7 | 71,9 |
| 2003 | 64,8 | 58,5 | 71,9 |
| 2004 | 65,3 | 58,9 | 72,4 |
| 2005 | 65,4 | 58,9 | 72,5 |
| 2006 | 66,7 | 60,4 | 73,3 |
| 2007 | 67,6 | 61,5 | 74,0 |
| 2008 | 68,0 | 61,9 | 74,3 |
| 2009 | 68,8 | 62,9 | 74,8 |
| 2010 | 68,94 | 63,1 | 74,9 |
| 2011 | 69,8 | 64,0 | 75,6 |
| 2012 | 70,2 | 64,6 | 75,9 |
| 2013 | 70,8 | 65,1 | 76,3 |
| 2014 | 70,9 | 65,3 | 76,5 |
| 2015 | 71,4 | 65,9 | 76,7 |
| 2016 | 71,9 | 66,5 | 77,1 |
This indicator is also constantly changing. He had some fluctuations throughout the described history of the country, but in general at the moment is constantly growing.
For urban residents, all figures are higher since 1961. This is due to the improvement of housing conditions, the tightening of hygienic standards, changes in health care.
In general, the country is experiencing a change in the population size for the better, including due to the increase in life expectancy. Track the dynamics of growth by year can be according to table 3.
Table 3. Natural population growth from 1950 to 2016.
| Year | Natural increase in absolute units, thousand people | Natural increase in the calculation for 1000 people, thousand people. | ||||
|---|---|---|---|---|---|---|
| Around the country | City residents | Villagers | Around the country | City residents | Villagers | |
| 1950 | 1715 | 734 | 981 | 16,8 | 16,4 | 17,1 |
| 1960 | 1896 | 896 | 1000 | 15,8 | 13,7 | 18,3 |
| 1970 | 773 | 559 | 213 | 5,9 | 6,9 | 4,3 |
| 1980 | 677 | 565 | 112 | 4,9 | 5,8 | 2,7 |
| 1990 | 333 | 246 | 87 | 2,2 | 2,2 | 2,3 |
| 1995 | -840 | -621 | -219 | -5,7 | -5,7 | -5,6 |
| 2000 | -959 | -677 | -281 | -6,6 | -6,3 | -7,3 |
| 2001 | -943 | -664 | -280 | -6,6 | -6,2 | -7,3 |
| 2002 | -935 | -641 | -295 | -6,5 | -6,0 | -7,7 |
| 2003 | -889 | -607 | -282 | -6,2 | -5,7 | -7,3 |
| 2004 | -793 | -533 | -260 | -5,5 | -5,1 | -6,9 |
| 2005 | -847 | -559 | -288 | -5,9 | -5,3 | -7,6 |
| 2006 | -687 | -457 | -230 | -4,8 | -4,3 | -6,0 |
| 2007 | -470 | -325 | -146 | -3,3 | -3,1 | -3,8 |
| 2008 | -362 | -249 | -113 | -2,5 | -2,4 | -3,0 |
| 2009 | -249 | -160 | -89 | -1,8 | -1,5 | -2,4 |
| 2010 | -240 | -158 | -82 | -1,7 | -1,5 | -2,1 |
| 2011 | -129 | -87 | -42 | -0,9 | -0,8 | -1,1 |
| 2012 | -4 | 2 | -6 | 0,0 | 0,0 | -0,1 |
| 2013 | 24 | 25 | -0,8 | 0,2 | 0,3 | 0,0 |
| 2014 | 30 | 32 | -2 | 0,2 | 0,3 | -0,1 |
| 2015 | 32 | 93 | -61 | 0,3 | 0,8 | -1,6 |
| 2016 | -2 | 72 | -74 | -0,01 | 0,7 | -2,0 |
As can be seen, the natural increase in 2016 has a negative value, but the total population has increased, which is probably due to migration.
Indicators of natural growth in the regions of Russia
To consider such an indicator over several years is too big a task, and therefore the data for 2016 and 2015 will be given below. They are discussed in detail in Table 4.
Table 4. Population change for 2015 and 2016.
| Name of the administrative unit | The number of 01.01.15, people. | Changes for 2015 | The number of 01.01.16, people. | Changes for 2016 | The number of 01.01.17, people. | ||||
|---|---|---|---|---|---|---|---|---|---|
| General increase, pers. | Natures increase, people | Migrats. increase, people | General increase, pers. | Natures increase, people | Migrats. increase, people | ||||
| Russian Federation | 146267288 | 277422 | 32038 | 245384 | 146544710 | 277422 | 32038 | 245384 | 146544710 |
| Central Federal District | 38951479 | 152840 | -68916 | 221756 | 39104319 | 152840 | -68916 | 221756 | 39104319 |
| Belgorod region | 1547936 | 2201 | -3717 | 5918 | 1550137 | 2201 | -3717 | 5918 | 1550137 |
| Bryansk region | 1232940 | -7199 | -5377 | -1822 | 1225741 | -7199 | -5377 | -1822 | 1225741 |
| Vladimir region | 1405613 | -8445 | -6903 | -1542 | 1397168 | -8445 | -6903 | -1542 | 1397168 |
| Voronezh region | 2331147 | 2330 | -9883 | 12213 | 2333477 | 2330 | -9883 | 12213 | 2333477 |
| Ivanovo region | 1036909 | -7071 | -4831 | -2240 | 1029838 | -7071 | -4831 | -2240 | 1029838 |
| Kaluga region | 1010486 | -714 | -2426 | 1712 | 1009772 | -714 | -2426 | 1712 | 1009772 |
| Kostroma region | 654390 | -2940 | -2303 | -637 | 651450 | -2940 | -2303 | -637 | 651450 |
| Kursk region | 1117378 | 2641 | -5173 | 7814 | 1120019 | 2641 | -5173 | 7814 | 1120019 |
| Lipetsk region | 1157865 | -1772 | -4297 | 2525 | 1156093 | -1772 | -4297 | 2525 | 1156093 |
| Moscow region | 7231068 | 87579 | -24 | 87603 | 7318647 | 87579 | -24 | 87603 | 7318647 |
| Oryol region | 765231 | -5510 | -3911 | -1599 | 759721 | -5510 | -3911 | -1599 | 759721 |
| Ryazan region | 1135438 | -5335 | -5336 | 1 | 1130103 | -5335 | -5336 | 1 | 1130103 |
| Smolensk region | 964791 | -6161 | -5575 | -586 | 958630 | -6161 | -5575 | -586 | 958630 |
| Tambov region | 1062421 | -12126 | -6667 | -5459 | 1050295 | -12126 | -6667 | -5459 | 1050295 |
| Tver region | 1315071 | -10327 | -8433 | -1894 | 1304744 | -10327 | -8433 | -1894 | 1304744 |
| Tula region | 1513570 | -7124 | -10000 | 2876 | 1506446 | -7124 | -10000 | 2876 | 1506446 |
| Yaroslavskaya oblast | 1271629 | 283 | -4379 | 4662 | 1271912 | 283 | -4379 | 4662 | 1271912 |
| Moscow | 12197596 | 132530 | 20319 | 112211 | 12330126 | 132530 | 20319 | 112211 | 12330126 |
| Northwestern Federal District | 13843556 | 10138 | -11634 | 21772 | 13853694 | 10138 | -11634 | 21772 | 13853694 |
| Republic of Karelia | 632533 | -2658 | -1924 | -734 | 629875 | -2658 | -1924 | -734 | 629875 |
| Komi Republic | 864424 | -7593 | 1145 | -8738 | 856831 | -7593 | 1145 | -8738 | 856831 |
| Arkhangelsk region, including the Nenets Autonomous District | 1183323 | -9245 | -1227 | -8018 | 1174078 | -9245 | -1227 | -8018 | 1174078 |
| Nenets Autonomous Okrug | 43373 | 465 | 364 | 101 | 43838 | 465 | 364 | 101 | 43838 |
| Arkhangelsk region without Nenets Autonomous District | 1139950 | -9710 | -1591 | -8119 | 1130240 | -9710 | -1591 | -8119 | 1130240 |
| Vologda region | 1191010 | -3325 | -1262 | -2063 | 1187685 | -3325 | -1262 | -2063 | 1187685 |
| Kaliningrad region | 968944 | 7495 | -443 | 7938 | 976439 | 7495 | -443 | 7938 | 976439 |
| Leningrad region. | 1775540 | 3317 | -8828 | 12145 | 1778857 | 3317 | -8828 | 12145 | 1778857 |
| Murmansk region | 766281 | -4108 | 276 | -4384 | 762173 | -4108 | 276 | -4384 | 762173 |
| Novgorod region | 618703 | -3011 | -3450 | 439 | 615692 | -3011 | -3450 | 439 | 615692 |
| Pskov region | 651108 | -4734 | -4658 | -76 | 646374 | -4734 | -4658 | -76 | 646374 |
| St. Petersburg | 5191690 | 34000 | 8737 | 25263 | 5225690 | 34000 | 8737 | 25263 | 5225690 |
| Southern Federal District | 14003828 | 40752 | -7609 | 48361 | 14044580 | 40752 | -7609 | 48361 | 14044580 |
| Republic of Adygea | 449171 | 2309 | -218 | 2527 | 451480 | 2309 | -218 | 2527 | 451480 |
| Republic of Kalmykia | 280564 | -1831 | 1048 | -2879 | 278733 | -1831 | 1048 | -2879 | 278733 |
| Krasnodar region | 5453329 | 60475 | 2739 | 57736 | 5513804 | 60475 | 2739 | 57736 | 5513804 |
| Astrakhan region | 1021287 | -2661 | 2297 | -4958 | 1018626 | -2661 | 2297 | -4958 | 1018626 |
| Volgograd region | 2557397 | -11460 | -5793 | -5667 | 2545937 | -11460 | -5793 | -5667 | 2545937 |
| Rostov region | 4242080 | -6080 | -7682 | 1602 | 4236000 | -6080 | -7682 | 1602 | 4236000 |
| North Caucasus Federal District | 9659044 | 58957 | 83768 | -24811 | 9718001 | 58957 | 83768 | -24811 | 9718001 |
| The Republic of Dagestan | 2990371 | 25289 | 38679 | -13390 | 3015660 | 25289 | 38679 | -13390 | 3015660 |
| The Republic of Ingushetia | 463893 | 8883 | 7090 | 1793 | 472776 | 8883 | 7090 | 1793 | 472776 |
| Kabardino-Balkaria | 860709 | 1545 | 5041 | -3496 | 862254 | 1545 | 5041 | -3496 | 862254 |
| Karachay-Cherkess Republic | 469060 | -1263 | 1264 | -2527 | 467797 | -1263 | 1264 | -2527 | 467797 |
| Republic of North Ossetia-Alania | 705270 | -1525 | 2750 | -4275 | 703745 | -1525 | 2750 | -4275 | 703745 |
| Chechen Republic | 1370268 | 23904 | 25062 | -1158 | 1394172 | 23904 | 25062 | -1158 | 1394172 |
| Stavropol region | 2799473 | 2124 | 3882 | -1758 | 2801597 | 2124 | 3882 | -1758 | 2801597 |
| Volga Federal District | 29715450 | -41806 | -17215 | -24591 | 29673644 | -41806 | -17215 | -24591 | 29673644 |
| Republic of Bashkortostan | 4071987 | -923 | 5004 | -5927 | 4071064 | -923 | 5004 | -5927 | 4071064 |
| Mari El Republic | 687435 | -1570 | 471 | -2041 | 685865 | -1570 | 471 | -2041 | 685865 |
| The Republic of Mordovia | 808888 | -1435 | -3528 | 2093 | 807453 | -1435 | -3528 | 2093 | 807453 |
| Republic of Tatarstan | 3855037 | 13693 | 10120 | 3573 | 3868730 | 13693 | 10120 | 3573 | 3868730 |
| Udmurtia | 1517472 | -308 | 2630 | -2938 | 1517164 | -308 | 2630 | -2938 | 1517164 |
| Chuvash Republic | 1238071 | -1443 | 891 | -2334 | 1236628 | -1443 | 891 | -2334 | 1236628 |
| Perm region | 2637032 | -2623 | 1391 | -4014 | 2634409 | -2623 | 1391 | -4014 | 2634409 |
| Kirov region | 1304348 | -6874 | -3211 | -3663 | 1297474 | -6874 | -3211 | -3663 | 1297474 |
| Nizhny Novgorod Region | 3270203 | -9936 | -10638 | 702 | 3260267 | -9936 | -10638 | 702 | 3260267 |
| Orenburg region | 2001110 | -6348 | 333 | -6681 | 1994762 | -6348 | 333 | -6681 | 1994762 |
| Penza region | 1355618 | -6915 | -5600 | -1315 | 1348703 | -6915 | -5600 | -1315 | 1348703 |
| Samara region | 3212676 | -6701 | -4650 | -2051 | 3205975 | -6701 | -4650 | -2051 | 3205975 |
| Saratov region | 2493024 | -5495 | -6685 | 1190 | 2487529 | -5495 | -6685 | 1190 | 2487529 |
| Ulyanovsk region | 1262549 | -4928 | -3743 | -1185 | 1257621 | -4928 | -3743 | -1185 | 1257621 |
| Ural federal district | 12275853 | 32250 | 28783 | 3467 | 12308103 | 32250 | 28783 | 3467 | 12308103 |
| Kurgan region | 869814 | -7918 | -2382 | -5536 | 861896 | -7918 | -2382 | -5536 | 861896 |
| Sverdlovsk region. | 4327472 | 2534 | 1010 | 1524 | 4330006 | 2534 | 1010 | 1524 | 4330006 |
| Tyumen region including autonomous regions | 3581293 | 34192 | 30079 | 4113 | 3615485 | 34192 | 30079 | 4113 | 3615485 |
| Khanty-Mansi Autonomous Area - Ugra | 1612076 | 14679 | 16527 | -1848 | 1626755 | 14679 | 16527 | -1848 | 1626755 |
| Yamalo-Nenets Autonomous District | 539985 | -5881 | 6091 | -11972 | 534104 | -5881 | 6091 | -11972 | 534104 |
| Tyumen region without autonomous regions | 1429232 | 25394 | 7461 | 17933 | 1454626 | 25394 | 7461 | 17933 | 1454626 |
| Chelyabinsk region | 3497274 | 3442 | 76 | 3366 | 3500716 | 3442 | 76 | 3366 | 3500716 |
| Siberian Federal District | 19312169 | 11862 | 22448 | -10586 | 19324031 | 11862 | 22448 | -10586 | 19324031 |
| Altai Republic | 213703 | 1458 | 1678 | -220 | 215161 | 1458 | 1678 | -220 | 215161 |
| The Republic of Buryatia | 978495 | 3789 | 5795 | -2006 | 982284 | 3789 | 5795 | -2006 | 982284 |
| Tyva Republic | 313777 | 1860 | 4240 | -2380 | 315637 | 1860 | 4240 | -2380 | 315637 |
| The Republic of Khakassia | 535796 | 985 | 672 | 313 | 536781 | 985 | 672 | 313 | 536781 |
| Altai region | 2384812 | -8038 | -3581 | -4457 | 2376774 | -8038 | -3581 | -4457 | 2376774 |
| Transbaikal region | 1087452 | -4440 | 2767 | -7207 | 1083012 | -4440 | 2767 | -7207 | 1083012 |
| Krasnoyarsk region | 2858773 | 7717 | 4964 | 2753 | 2866490 | 7717 | 4964 | 2753 | 2866490 |
| Irkutsk region | 2414913 | -2113 | 4001 | -6114 | 2412800 | -2113 | 4001 | -6114 | 2412800 |
| Kemerovo region | 2724990 | -7363 | -5422 | -1941 | 2717627 | -7363 | -5422 | -1941 | 2717627 |
| Novosibirsk region | 2746822 | 15415 | 3050 | 12365 | 2762237 | 15415 | 3050 | 12365 | 2762237 |
| Omsk region | 1978183 | 283 | 2083 | -1800 | 1978466 | 283 | 2083 | -1800 | 1978466 |
| Tomsk region | 1074453 | 2309 | 2201 | 108 | 1076762 | 2309 | 2201 | 108 | 1076762 |
| Far Eastern Federal District | 6211021 | -16052 | 8112 | -24164 | 6194969 | -16052 | 8112 | -24164 | 6194969 |
| The Republic of Sakha (Yakutia) | 956896 | 2793 | 8180 | -5387 | 959689 | 2793 | 8180 | -5387 | 959689 |
| Kamchatka Krai | 317269 | -1153 | 510 | -1663 | 316116 | -1153 | 510 | -1663 | 316116 |
| Primorsky Krai | 1933308 | -4300 | -1509 | -2791 | 1929008 | -4300 | -1509 | -2791 | 1929008 |
| Khabarovsk region | 1338305 | -3753 | 1174 | -4927 | 1334552 | -3753 | 1174 | -4927 | 1334552 |
| Amur region | 809873 | -4184 | -416 | -3768 | 805689 | -4184 | -416 | -3768 | 805689 |
| Magadan region | 148071 | -1726 | 5 | -1731 | 146345 | -1726 | 5 | -1731 | 146345 |
| Sakhalin region | 488391 | -1098 | 196 | -1294 | 487293 | -1098 | 196 | -1294 | 487293 |
| Jewish Autonomous Region | 168368 | -2248 | -234 | -2014 | 166120 | -2248 | -234 | -2014 | 166120 |
| Chukotka Autonomous Region | 50540 | -383 | 206 | -589 | 50157 | -383 | 206 | -589 | 50157 |
| Crimean Federal District | 2294888 | 28481 | -5699 | 34180 | 2323369 | 28481 | -5699 | 34180 | 2323369 |
| Republic of Crimea | 1895915 | 11191 | -5106 | 16297 | 1907106 | 11191 | -5106 | 16297 | 1907106 |
| Sevastopol | 398973 | 17290 | -593 | 17883 | 416263 | 17290 | -593 | 17883 | 416263 |
Where do population data come from?
Annually, the site www.gks.ru, owned by Rosstat, publishes information on changes in all demographic indicators, including:
- number (by age, gender division);
- density;
- natural growth;
- mortality;
- fertility;
- average life expectancy.
Data is obtained in the following way:
- The number of births per year is added to the last result of the population census;
- Summarize the number of arrivals for permanent residence in Russia;
- Subtract the number of deaths and departures.

Indicators are calculated for:
- countries in general;
- each federal district;
- each region;
- cities;
- intracity areas;
- administrative districts.
The obtained data is laid out on the Rosstat website and is not limited in access, that is, anyone can get acquainted with them. They also allow calculations to all departments of the Russian Federation to establish the number of subsidies and other preferential payments.
Some more additional information about the demographic situation in Russia is in the following video.


